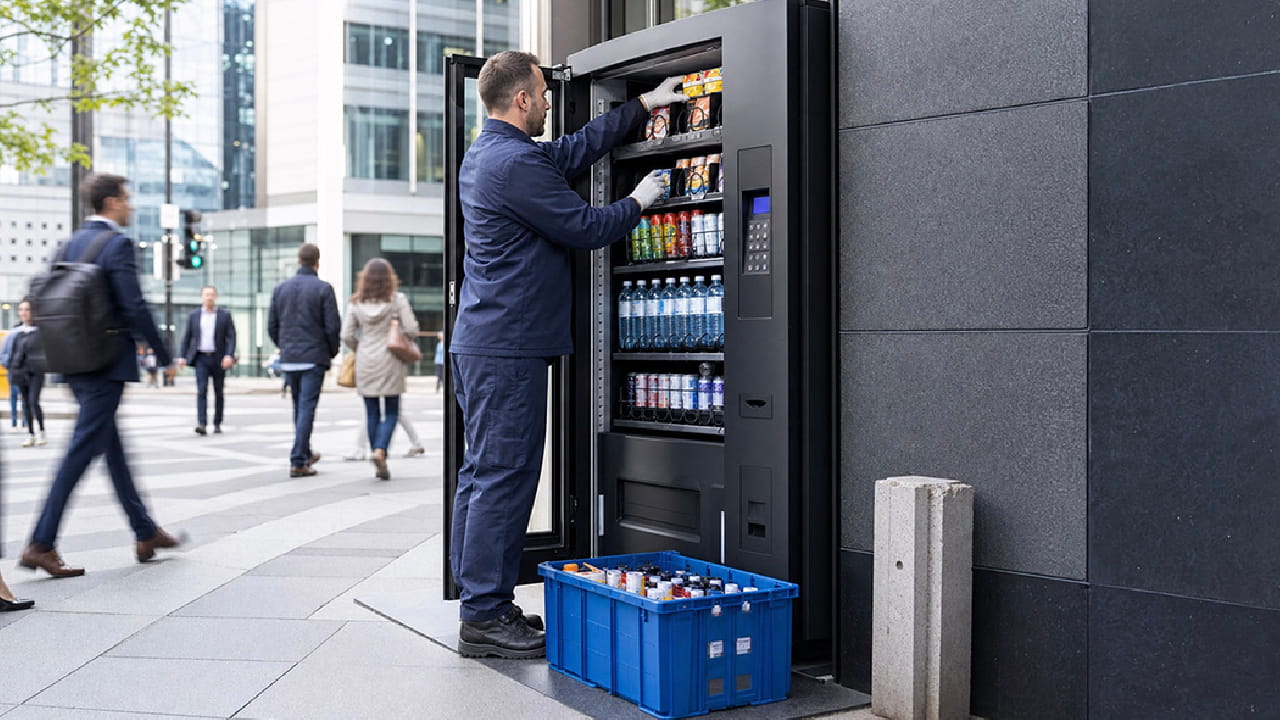
A client recently asked us how to improve his unattended retail business.
We asked him what mattered most in the vending machine business. He answered without pause:
“Pick a good location. Keep the machine full. And stock more drinks when it‘s hot.”
He is not alone. Most operators entering the vending market think the same way.
Our first advice was simple: If you want the business to grow, move from instinct to data-driven operations.
This was also the starting point for our Operational Intelligence Platform.
The data makes the case for us. We reviewed a public dataset from Central New Jersey. It includes a full year of transaction data from five vending machines across four locations: a library, a mall, an office site, and a manufacturing site.
After analyzing the records, we found five truths that many operators miss. We share them here in the hope they help operators like him.
Analyze each machine on its own, even at the same site
The first signal came from product category sales. The five machines used similar products and similar operating logic. The results were very different.
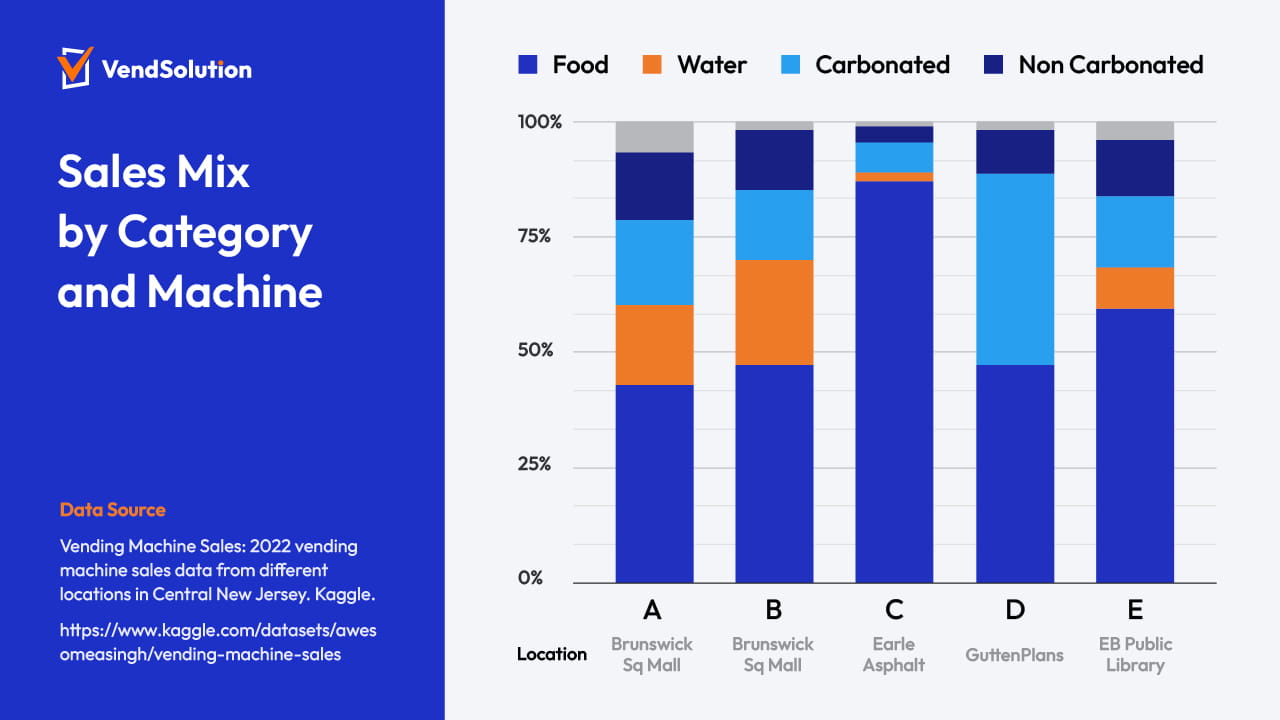
Machine C at Earle Asphalt sold almost no water. The machine at GuttenPlans had the highest carbonated sales among the five. A standard planogram across all machines is rarely the best strategy.
You might then assume that two machines inside the same venue serve the same customers and should carry the same products.
The data says otherwise.
The chart below shows product sales rankings for Machines A and B, both in Brunswick Square Mall. Machine A sits at the AT&T store. Machine B sits at Zales.
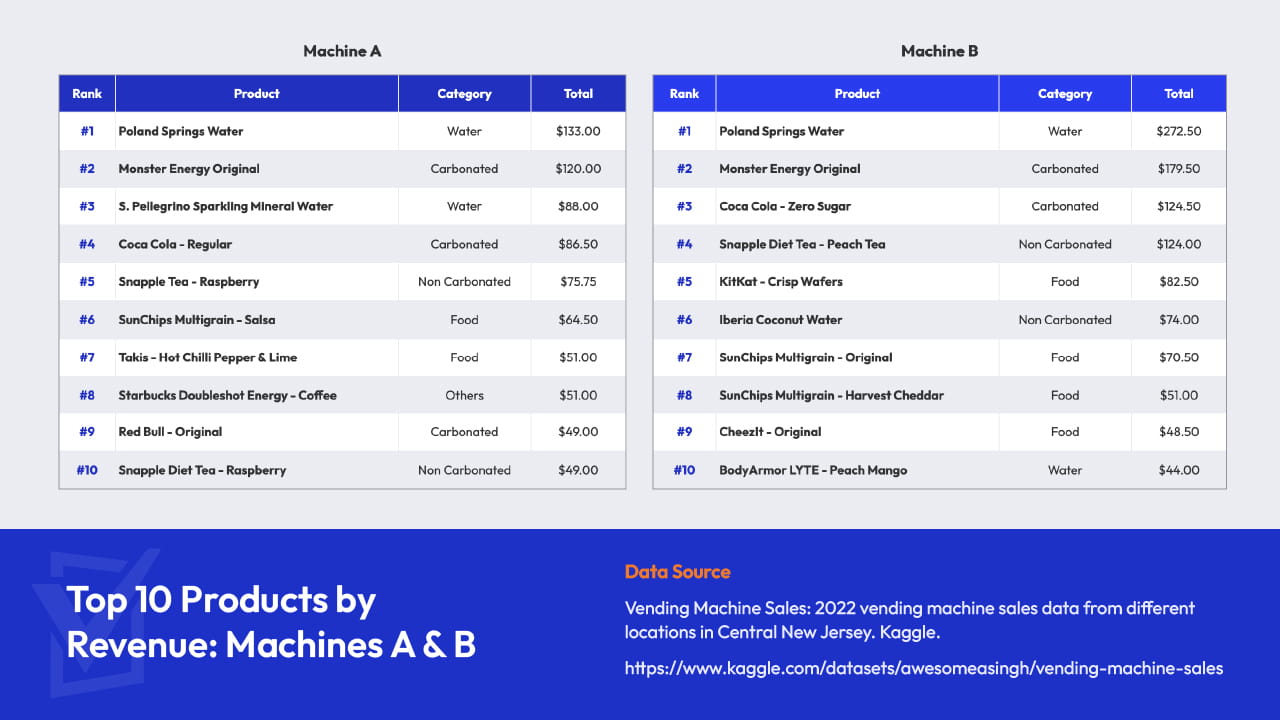
Under the same roof, buying behavior diverges. Machine A skews heavily toward beverages. Machine B shows a clear preference for food. Four of its top 10 products were food items.
This suggests that customers near the Zales location were more likely to add snacks when buying a drink.
Operator takeaway: location strategy matters, but machine-level data matters more. Each machine needs its own product mix, pricing view, and replenishment plan.
More variety does not mean more sales
The old retail instinct says: give customers more choices and they will buy more.
This idea leads to oversized machines filled with too many SKUs. Operators add obscure brands and niche products in the hope of covering every possible customer need.
The data pushes back hard on this approach.
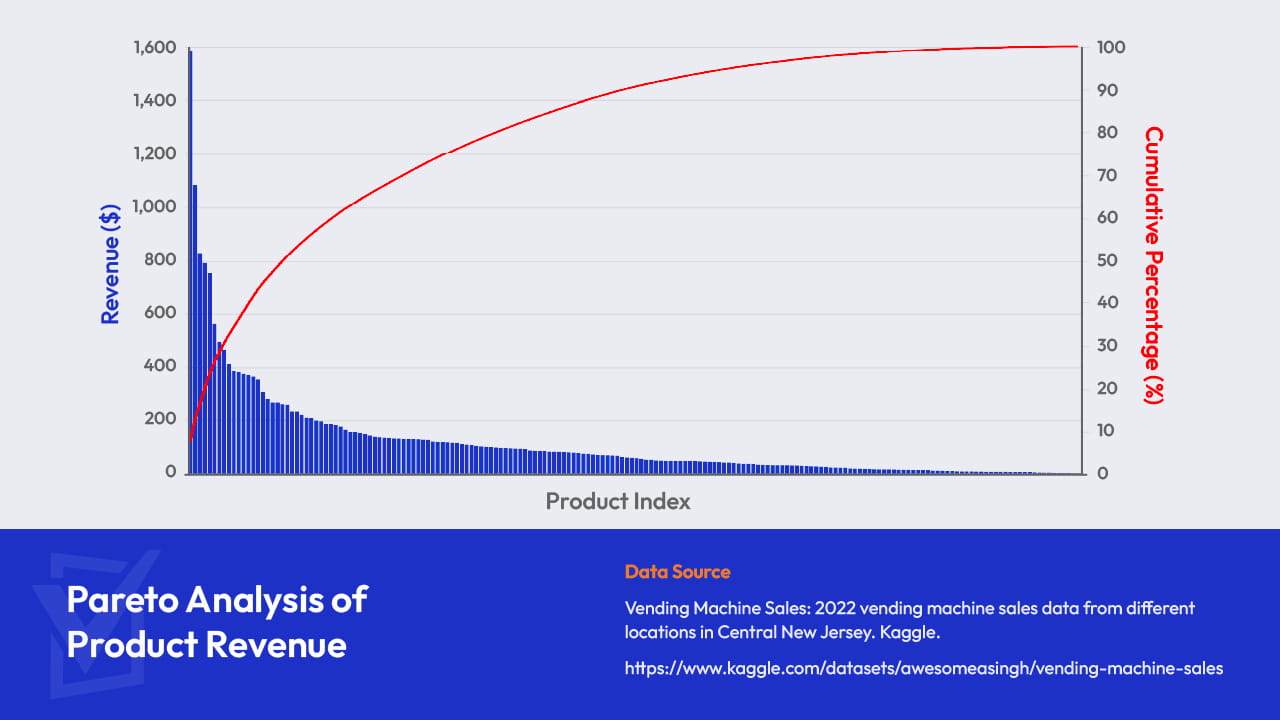
A small group of SKUs generated most of the revenue. Behind them sat a long, flat tail of underperforming “zombie” products.
Operational intelligence tells us that slots are a scarce resource. In this dataset, 28 products generated less than $10 in annual revenue each. Most were in the food category. They stayed in the machine, took up space, and sold fewer than five units a year. Together, they contributed less than $200 in annual revenue.
Cut products that sell fewer than five units per month and reassign those slots to proven movers. The direct gain is about $3,000 to $5,000 per year.
Real-time stockout alerts should also focus on the top 20% of sellers first. One day of a Monster stockout can cost more than a full year of contribution from 10 weak SKUs.
Inventory cash should follow the same logic. Strong sellers deserve better purchase planning and better bulk pricing.
Card users spend more than cash users
Many operators see card readers as a cost. Merchant fees are visible, so cashless payment can feel like a necessary expense. Few actively push customers toward digital payment.
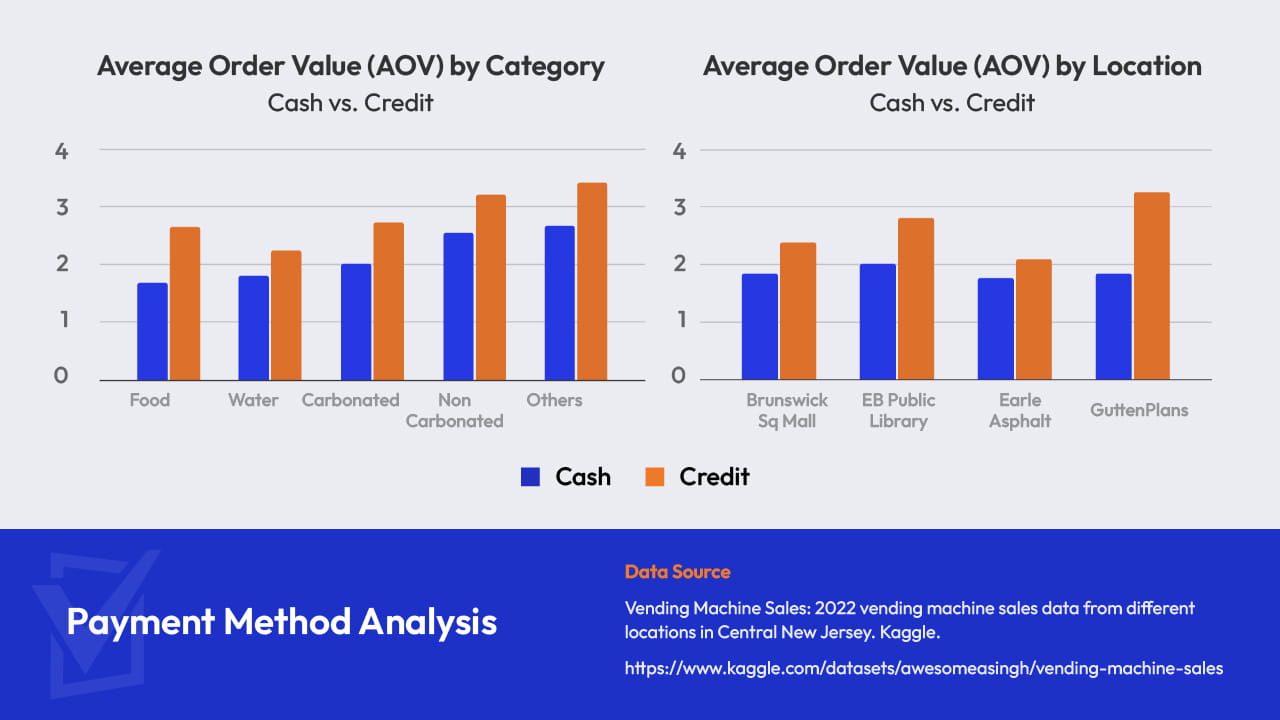
The data shows something worth paying attention to. Card users spent $0.86 more per transaction than cash users, a 46% lift. The gap held across every category and every location.
Payment friction explains this well. When customers pay with cash, or prefer to, they limit themselves to small purchases. They avoid change, dislike handling coins, and feel the cost more strongly when handing over physical cash.
Card users face less friction, so they are more likely to buy higher-priced products or add a second item.
Raising the share of card payments raises the average ticket. Payment behavior can be nudged, and the return on doing so is high because the price gap already exists. Most operators simply are not nudging.
A simple machine message such as “Buy two with card, save $0.50” could lift the card share to an estimated 42% to 55%. In this dataset, that shift could add about $2,200 in annual revenue with very little added cost.
The soda paradox: people do not always act on their health claims
Food and beverage brands have spent years promoting healthier, more mindful consumption. The market keeps pushing organic teas and plant-based drinks to replace traditional soda.
Operators respond by giving non-carbonated options more space, especially in venues tied to study, quiet focus, or wellness.
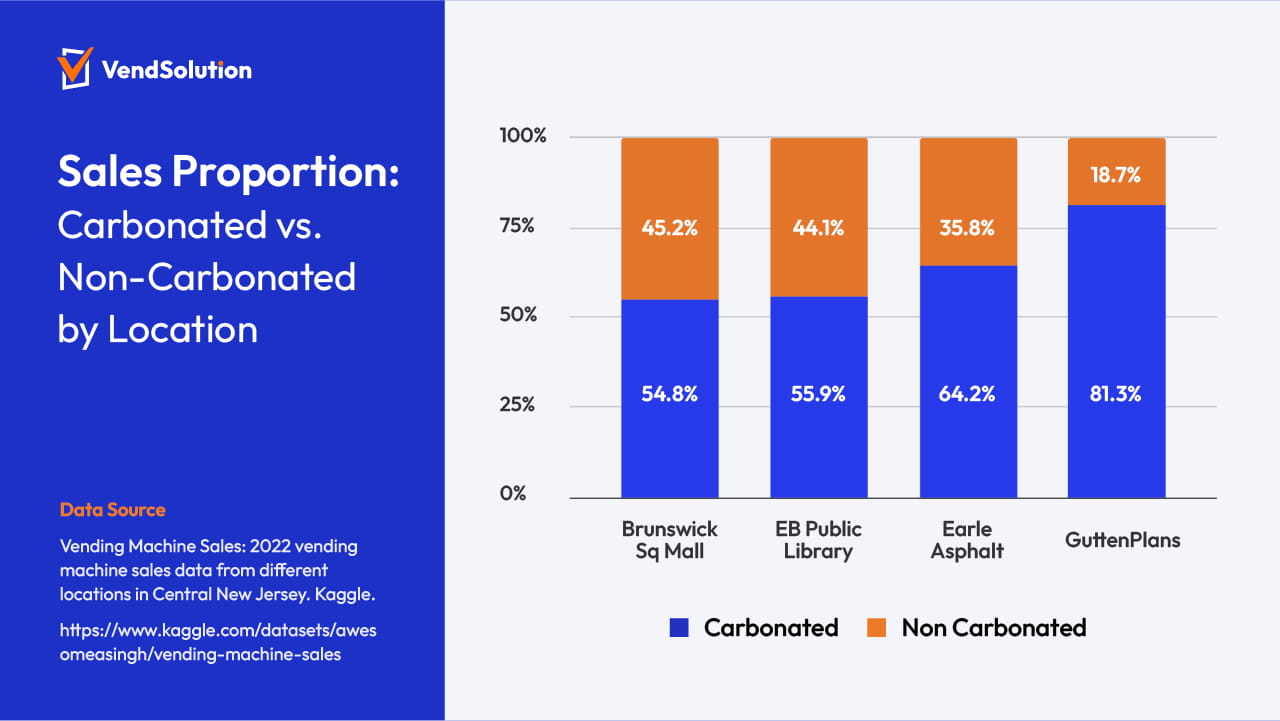
In the Central New Jersey dataset, carbonated and caffeinated drinks outperformed non-carbonated teas within the beverage mix at each site.
At the library, Coca-Cola led with 287 units. At GuttenPlans, Monster Energy Original led with 420 units.
The two sites serve different needs. Library users may face long periods of cognitive tasks. Manufacturing-site users may face physical fatigue.
Neither group is mainly chasing hydration. They want neurochemical stimulation, caffeine, and the sensory hit of carbonation to push back against fatigue.
The lesson is direct. Survey answers and point-of-sale behavior can differ. Stock the machine for what customers buy in the moment, not only for what they say they prefer.
Standardized restocking routes are not the best answer
Many unattended retail operators build routes around labor efficiency and fuel cost.
They send drivers on fixed days and divide routes by geography. Some send drivers on Saturday or Sunday because they fear weekend stockouts.
This approach is based on human convenience and location proximity. It is not always based on demand.
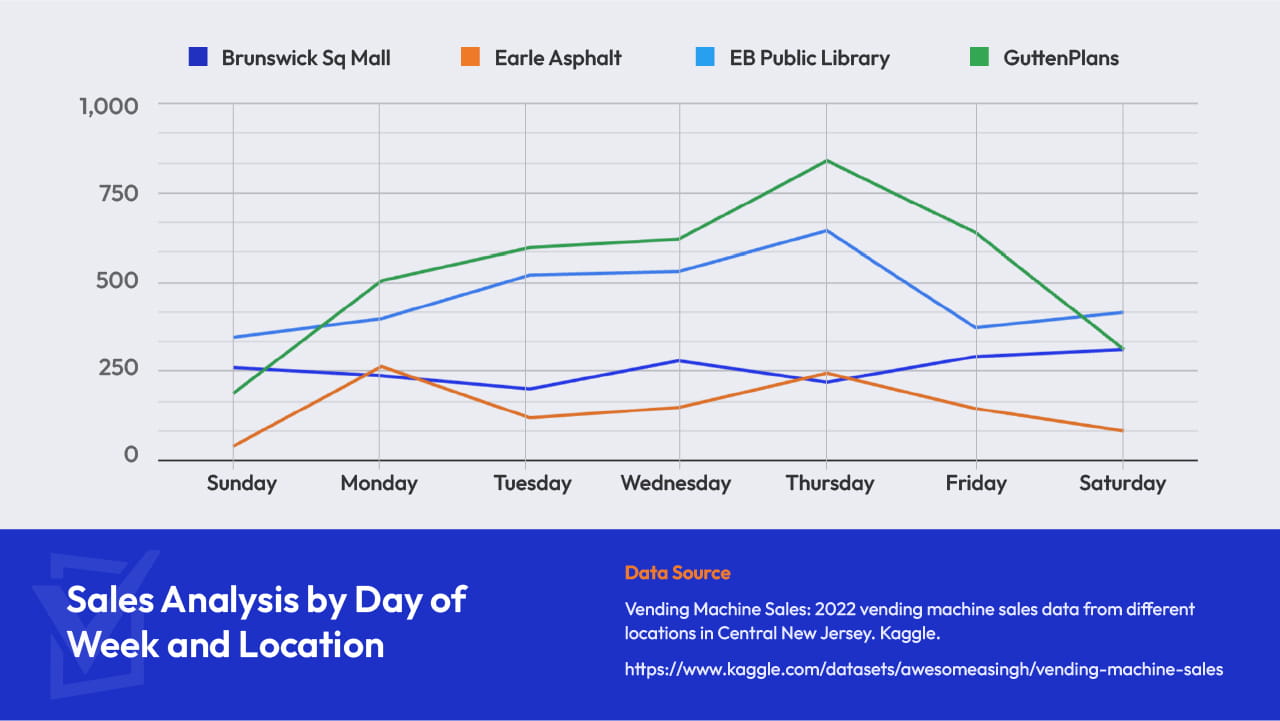
In this dataset, the library peaked on Thursdays. The office site bottomed out on weekends. Earle Asphalt recorded only 121 weekend transactions for the full year. That equals 0.33 transactions per day. Sending a driver there every Saturday is a waste of fuel and labor.
Hourly patterns vary just as much. Offices peak at lunch (11:30 AM to 1:30 PM). Transit hubs and gyms peak during the evening commute (5:00 PM to 8:00 PM). 24-hour venues peak late at night.
Our take: demand in modern unattended retail is sharply uneven. Running a single static route plan across these very different micro-economies leads to wasted trips, missed sales, and capital tied up in the wrong places.
Modern VMS like VendSolution support proactive inventory alerts and smarter replenishment planning. The system can estimate stockout speed from each machine’s daily sales curve.
For example, if sales data shows that GuttenPlans will run out of carbonated drinks on Monday night, the system should schedule a driver for Tuesday morning and also skip mall machines that still have enough inventory.
This kind of dynamic routing and inventory planning is a practical path to stronger gross margin at scale.
Conclusion: Move from instinct to intelligent unattended retail
Back to the conversation with our client. The Central New Jersey dataset answers his question well.
The era of “set and forget” vending is over. What we see now is a complex, constantly shifting ecosystem. Consumer behavior in unattended retail is not fixed. It moves with the location, physical need, payment method, etc.
About 125 million automated retail transactions happen every day worldwide. No operator can manage that level of data with instinct or a spreadsheet.
The next stage of vending operations depends on a connected view of hardware, payments, inventory, routes, and predictive analysis. They are how the vending business survives.
Use data to ask better questions. If you want to manage your unattended retail business on a platform with Operational Intelligence, talk to us.
Note: All data in this article comes from an open-source vending machine dataset covering the complete 2022 sales records of five machines in Central New Jersey.